
The proposed web service bridges the gap between remote sensing applications and their data access pattern requirements through a simple and effective representation for time series data.
The objective of the WTSS is to bring to the remote sensing research community an easy way to access and consume satellite image data in the form of time series, saving the researcher’s time when dealing with a large volume of data. This web service can be easily integrated into open source technologies like R and web applications for data analysis and visualization.

In WTSS context, the remote sensing imagery is organized as coverage.
Basically, coverage is a three-dimensional array associated with spatial and temporal reference systems (Image 1).
WTSS is based on three operations:
Given a coordinate latitude/longitude, coverage and attributes, the WTSS transforms the input location into grid coordinate and iterates over all remote sensing imagery and get the serie value as described in Image 2.


The WTSS can be easily integrated into free and open source technologies such as R and web application for data analysis and visualization. We have implemented client libraries in Python and R which fully supports the WTSS spec and we also developed a QGIS Plugin.
The clients may also be used for interactive programming like Jupyter Notebooks and R Notebooks. For example, in Python environment, it was implemented a plot method for TimeSeries object. In this case, all the time series can be visualized dynamically as shown in the Image 3.
You can access all examples in

The WTSS can also be used to improve the validation and generation of land use land cover maps.
Artigo referência:
More information in Brazil Data Cube Organization in GitHub:
Associated publications:
Vinhas, L.; Queiroz, G. R.; Ferreira, K. R.; Camara, G. Web Services for Big Earth Observation Data. Revista Brasileira de Cartografia, v. 69, n. 5, 18 maio 2017.

Associated publications
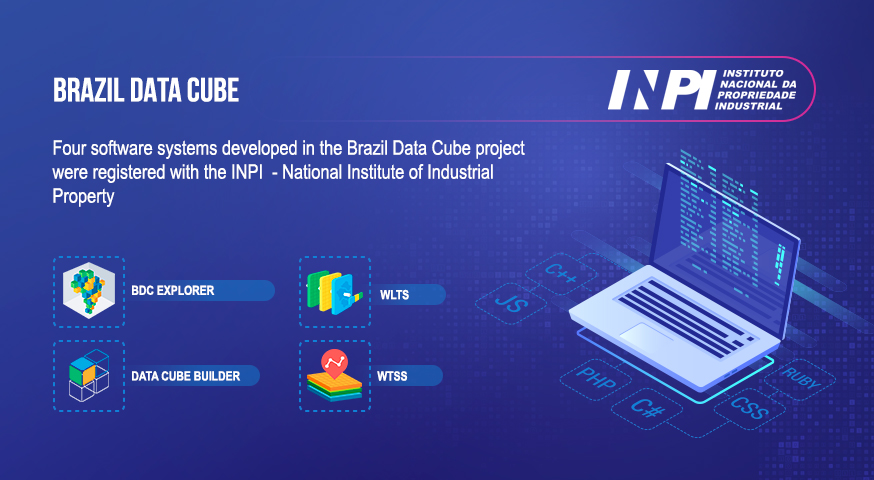
The Brazil Data Cube team has just registered four software systems developed in the project with the National Institute of Industrial Property (INPI). The number of computational systems registered with INPI is one of the productivity indicators of the National Institute for Space Research (INPE) and its postgraduate courses. The registered systems are: (1) Web …


