
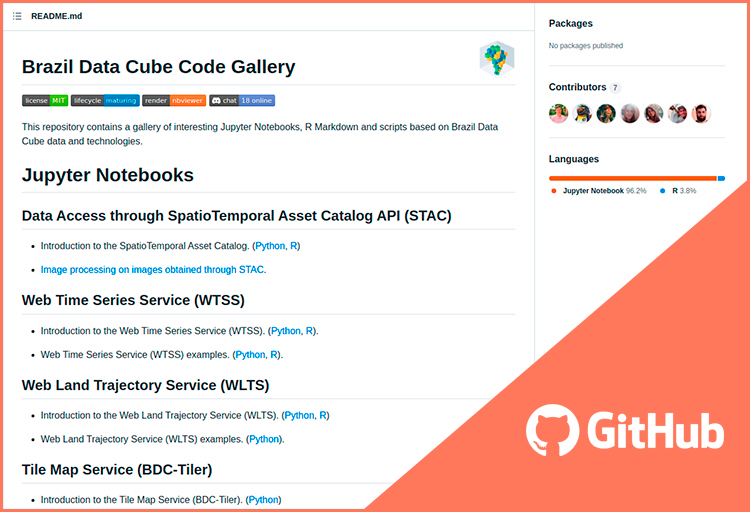
A gallery of interesting Jupyter Notebooks, R Markdown and scripts based on Brazil Data Cube data and technologies.

The Brazil Data Cube project has a code gallery in Jupyter Notebook and R Markdown based on the project data products and technologies.
Jupyter Notebooks are documents that can merge formatted text elements such as tables and formulas with code in R or Python languages to generate graphs, maps and other applications. The code gallery is openly available on GitHub so that everyone can learn from these documents and use the BDC services and applications.
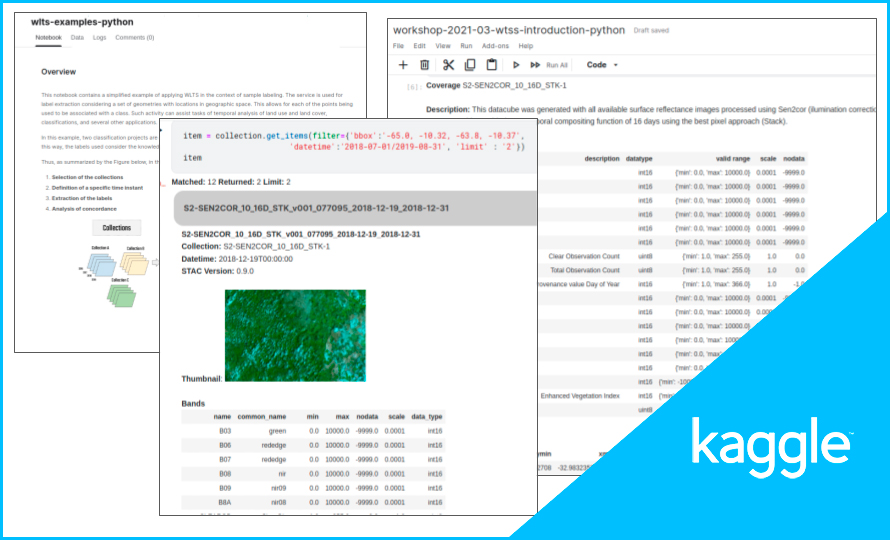
Brazil Data Cube also has a series of notebooks in Kaggle environment.
Kaggle allows its users to find datasets and build models in a web environment in Python and R languages. The notebooks present step-by-step of how to use the client library for STAC (SpatioTemporal Asset Catalog), WTSS (Web Time Series Service), and WLTS (Web Land Trajectory Service) services, as well as the use of the SITS R Package.
In the kaggle notebooks, some introductory concepts on digital image processing and practice with the Brazil Data Cube project images provided by the STAC service are presented. It is shown how to use the WTSS service to extract time series from the Brazil Data Cube service and how to perform basic time series manipulation. It also provides an overview of using WLTS to discover and access land cover and land use trajectory data from known projects, including PRODES, DETER, and TerraClass. The SITS package also presents how to perform satellite time series classification using machine learning algorithms and a predefined samples set to generate classified thematic maps.
The Kaggle platform has been used in several workshops offered by the BDC. Some examples include the Workshop on Applied Computing (WorCAP), an event of the Postgraduate Applied Computing (CAP) program of the National Institute for Space Research (INPE). Brazil Data Cube Workshop with the Brazilian Institute of Geography and Statistics (IBGE) gathers the technical-scientific community from the Remote Sensing and Geotechnologies areas of IBGE for training on the use of services, data, and tools provided by the BDC for land use and land cover studies. Brazilian Symposium of Remote Sensing 2021 (SBSR), an event that brings together the scientific community, technicians, and users in Remote Sensing and Geotechnologies and their applications to present their most recent research and technological developments.
To access the documents, access the links:
Code Gallery GitHub: https://github.com/brazil-data-cube/code-gallery
Brazil Data Cube Kaggle: https://www.kaggle.com/brazildatacube