 BIG Catalogue
COG
Type of resources
Topics
Provided by
Formats
Representation types
Update frequencies
status
-
The Aqua Moderate Resolution Imaging Spectroradiometer (MODIS) Land Surface Temperature/Emissivity 8-Day (MYD11A2) Version 6.1 product provides an average 8-day per-pixel Land Surface Temperature and Emissivity (LST&E) with a 1 kilometer (km) spatial resolution in a 1,200 by 1,200 km grid. Each pixel value in the MYD11A2 is a simple average of all the corresponding MYD11A1 LST pixels collected within that 8-day period. The 8-day compositing period was chosen because twice that period is the exact ground track repeat period of the Terra and Aqua platforms. Provided along with the daytime and nighttime surface temperature bands are associated quality control assessments, observation times, view zenith angles, and clear-sky coverages along with bands 31 and 32 emissivities from land cover types.
-
The Terra Moderate Resolution Imaging Spectroradiometer (MODIS) Land Surface Temperature/Emissivity 8-Day (MOD11A2) Version 6.1 product provides an average 8-day per-pixel Land Surface Temperature and Emissivity (LST&E) with a 1 kilometer (km) spatial resolution in a 1,200 by 1,200 km grid. Each pixel value in the MOD11A2 is a simple average of all the corresponding MOD11A1 LST pixels collected within that 8-day period. The 8-day compositing period was chosen because twice that period is the exact ground track repeat period of the Terra and Aqua platforms. Provided along with the daytime and nighttime surface temperature bands are associated quality control assessments, observation times, view zenith angles, and clear-sky coverages along with bands 31 and 32 emissivities from land cover types.
-

Sentinel-2 image mosaic of Brazil with 10m of spatial resolution. More information on LCF can be found at Brazil Data Cube web site (https://brazil-data-cube.github.io/specifications/processing-flow.html#temporal-compositing).
-

Sentinel-2 image mosaic of Brazil with 10m of spatial resolution. It uses True color composition based on the MSI bands 04, 03 and 02 assigned to RGB channels. It's input is the 16 days Least Cloud Cover First (LCF) datacube. More information on LCF can be found at Brazil Data Cube web site (https://brazil-data-cube.github.io/specifications/processing-flow.html#temporal-compositing).
-
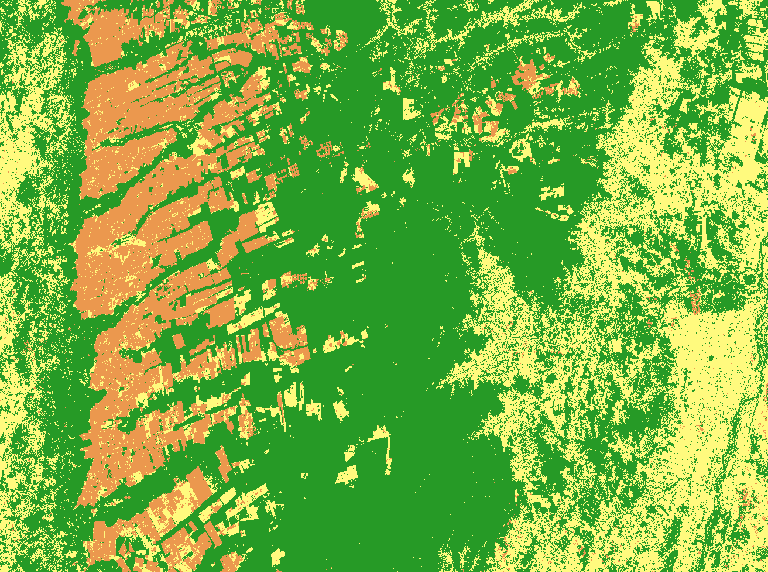
This land cover classification refers to a study area in Bahia state, in the Cerrado biome. For this map, the Landsat-8 monthly data cube was used, with a spatial resolution of 30 meters, using the best pixel composition function named as Least Cloud Cover First (LCF), which was previously named Stack in BDC older versions. This experiment uses the time series of an agricultural calendar year, from September 2018 to August 2019, extracted from the Sentinel-2 data cube. The input datacube was Landsat-8 - OLI - Cube Stack 16 days - v001, which was deprecated. The classification was made using 922 samples (Pasture: 258; Agriculture: 242; Natural Vegetation: 422). The spectral band used were B1, B2, B3, B4, B5, B6, and B7 along with the vegetation indices EVI and NDVI; the clouded observation were identified using the Fmask4 algorithm and estimated using linear interpolation. We trained a multi-layer perceptron for a deep learning classification network to classify the data cube using sits R package. Validation was done using good practice guidelines by Olofsson. The validation was done independently for each map using the PRODES Cerrado data of 2019. This data obtained overall accuracy (OA) 0.90. For more information see the paper <a href="https://www.mdpi.com/2072-4292/12/24/4033" target="_blank">Earth Observation Data Cubes for Brazil: Requirements, Methodology and Products.</a> This product was funded by the Brazilian Development Bank (BNDES).
-
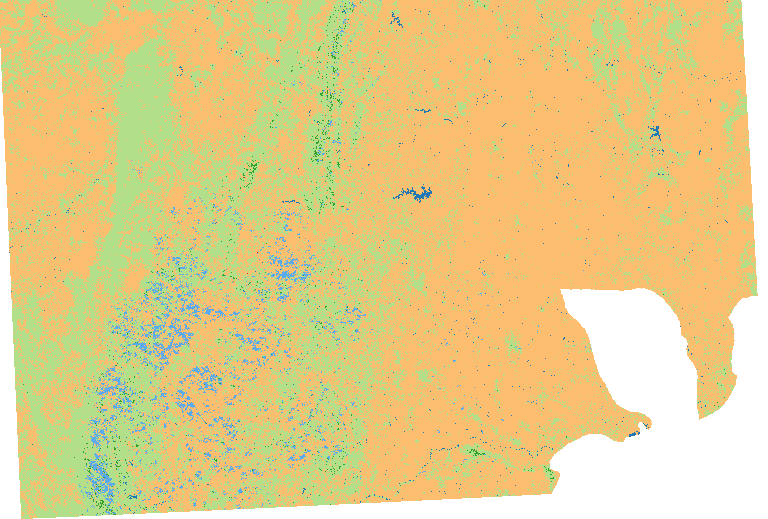
This land cover classification refers to a study area in Mato Grosso state, in the Cerrado biome. For this map, the CBERS-4/WFI monthly data cube was used, with a spatial resolution of 64 meters, using the best pixel composition function named as Least Cloud Cover First (LCF), which was previously named Stack in BDC older versions. This experiment uses the time series of an agricultural calendar year, from September 2018 to August 2019, extracted from the CBERS-4/WFI data cube. The input datacube was CBERS-4 (WFI) Cube Identity - v001, which was deprecated. The classification was made using 852 samples (Annual Crop: 257; Natural Vegetation: 245; Pasture: 216; Semi-Perennial Crop: 134) and the following data cube bands: bands red, green, blue, and near-infrared along with the EVI, NDVI, GEMI, GNDVI, NDWI2, PVR indices. We trained a multi-layer perceptron for a deep learning classification network to classify the data cube using sits R package. This product was funded by the Brazilian Development Bank (BNDES).
-

Earth Observation Data Cube generated from Landsat Level-2 product over Brazil extension. This dataset is provided in Cloud Optimized GeoTIFF (COG) file format. The dataset is processed with 30 meters of spatial resolution, reprojected and cropped to BDC_MD grid Version 2 (BDC_MD V2), considering a temporal compositing function of 16 days using the Least Cloud Cover First (LCF) best pixel approach.
-

This collection contains images from the WFI sensor onboard the satellites CBERS-4, CBERS-4A and AMAZONIA-1 over Brazil. The data is processed by the Disasters Charter and provided as Cloud Optimized GeoTIFF (COG). This products has four spectral bands: Blue, Green, Red and NIR.
-
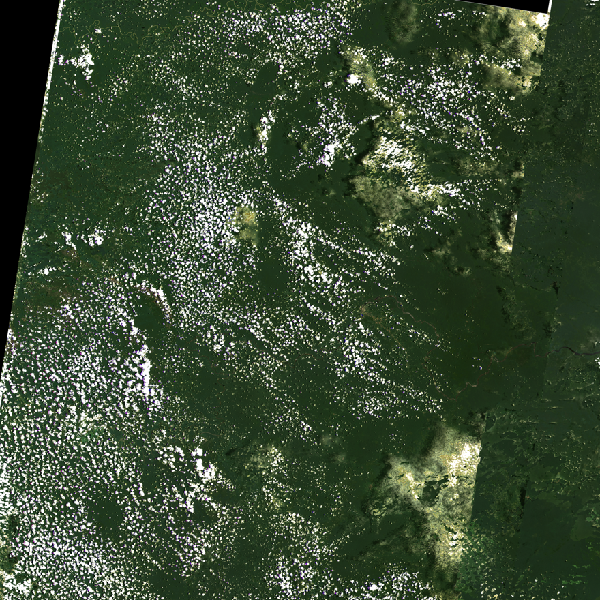
Landsat-8/OLI image mosaic of Brazilian Amazon biome with 30m of spatial resolution. The mosaic was prepared in support of TerraClass project. The true color composition is based on the OLI bands 4, 3 and 2 assigned to RGB channels. The temporal composition encompasses 03-months of images, starting in July 2016 and ending in September of 2016, with a best pixel selection approach called Least Cloud Cover First (LCF). More information on LCF can be found at Brazil Data Cube web site (https://brazil-data-cube.github.io/specifications/processing-flow.html#temporal-compositing). This Image Mosaic used more than 1200 Landsat/OLI scenes and was generated based on an existing data cube of Landsat images.
-
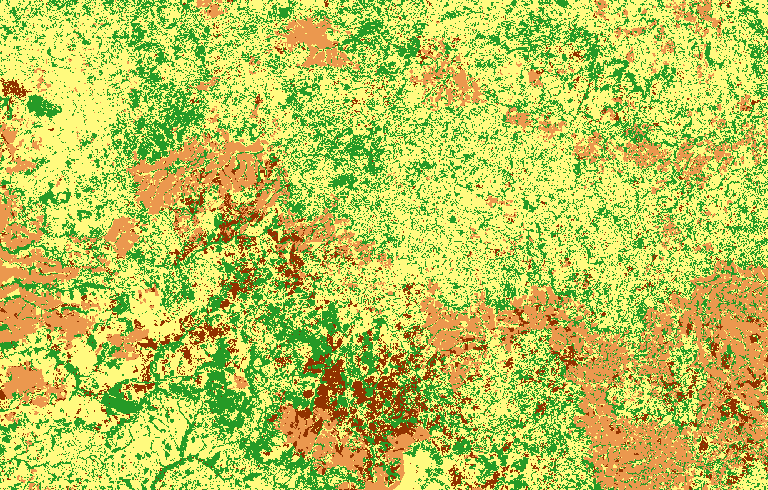
This is a land cover classification map of Brazilian Caatinga, from January to December of 2017. This classification was made on top of Landsat-8 16 days data cubes with spatial resolution of 30 meters, using the best pixel composition function named as Least Cloud Cover First (LCF), which was previously named Stack in BDC older versions. The input datacube was Landsat-8 - OLI - Cube Stack 16 days - v001, which was deprecated. The classification model was trained using 9324 sample points of the classes Agriculture 172, Country formation 577, Forest (Formação florestal) 222, Savanna 4819, Pasture 3538. The spectral band used were B1, B2, B3, B4, B5, B6, B7, along with the vegetation indices EVI and NDVI; the clouded observation were identified using the Fmask algorithm and estimated using linear interpolation. The classification algorithm was Random Forest. The post-processing consisted on cropping the images to the biome's boundary. This product was funded by the Brazilian Development Bank (BNDES).