
GGSOM: Ferramenta de visualização baseada em mapas auto-organizaveis
by Felipe Carvalho de Souza¹, Rafael Duarte Coelho dos Santos¹, Karine Reis Ferreira¹
1 – Instituto Nacional de Pesquisas Espaciais (INPE) Sao José dos Campos – SP – Brazil
ISSN: 2179-4847
Publisher: XX GEOINFO | Published: 13 November 2019.
Abstract
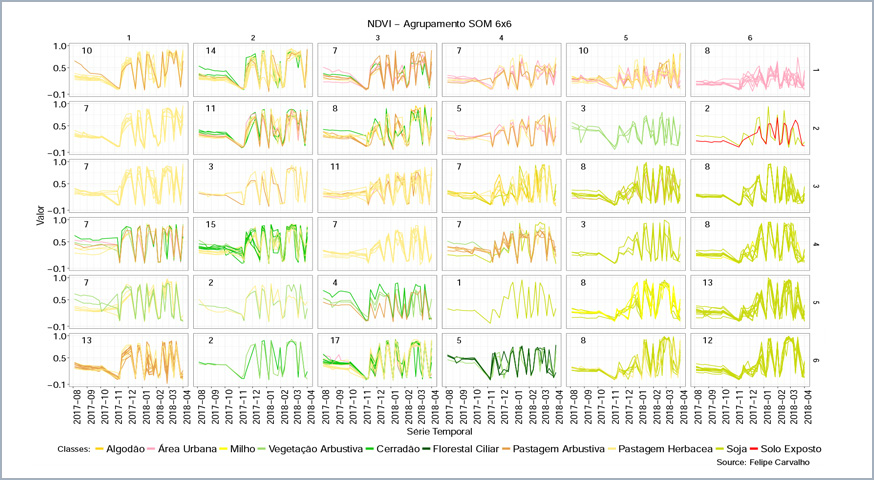
Analysis of multidimensional and time series data is useful and pertinent to several different applications, being a challenge due to the volume and complexity of the data. A possible approach for analysis of this kind of data is to use clustering algorithms to reduce the dimensionality of the data. This paper presents a tool for clustering and visualization of data, called ggsom, which uses a technique for data dimensionality reduction through projection of the data in a smaller number of dimensions by the Kohonen’s Self-Organizing Map. The tool is evaluated with data from time series of vegetation coverage from Bahia
state.
Keywords: geoinformatica, time series
© This is an open access article distributed under the Creative Commons Attribution License which permits unrestricted use, distribution, and reproduction in any medium, provided the original work is properly cited
Share and Cite
SOUZA, F. C.; SANTOS, R. D. C.; FERREIRA, K. R. GGSOM: ferramenta de visualização baseada em mapas auto-organizáveis. In: SIMPÓSIO BRASILEIRO DE GEOINFORMÁTICA, 20. (GEOINFO), 2019, São José dos Campos. Anais do 20º Simpósio Brasileiro de Geoinformática… São José dos Campos: INPE, 2019. On-line. ISSN 2179-4847. IBI: <8JMKD3MGPDW34R/3UFHMQ8>. Disponível em: <http://urlib.net/ibi/8JMKD3MGPDW34R/3UFHMQ8>.